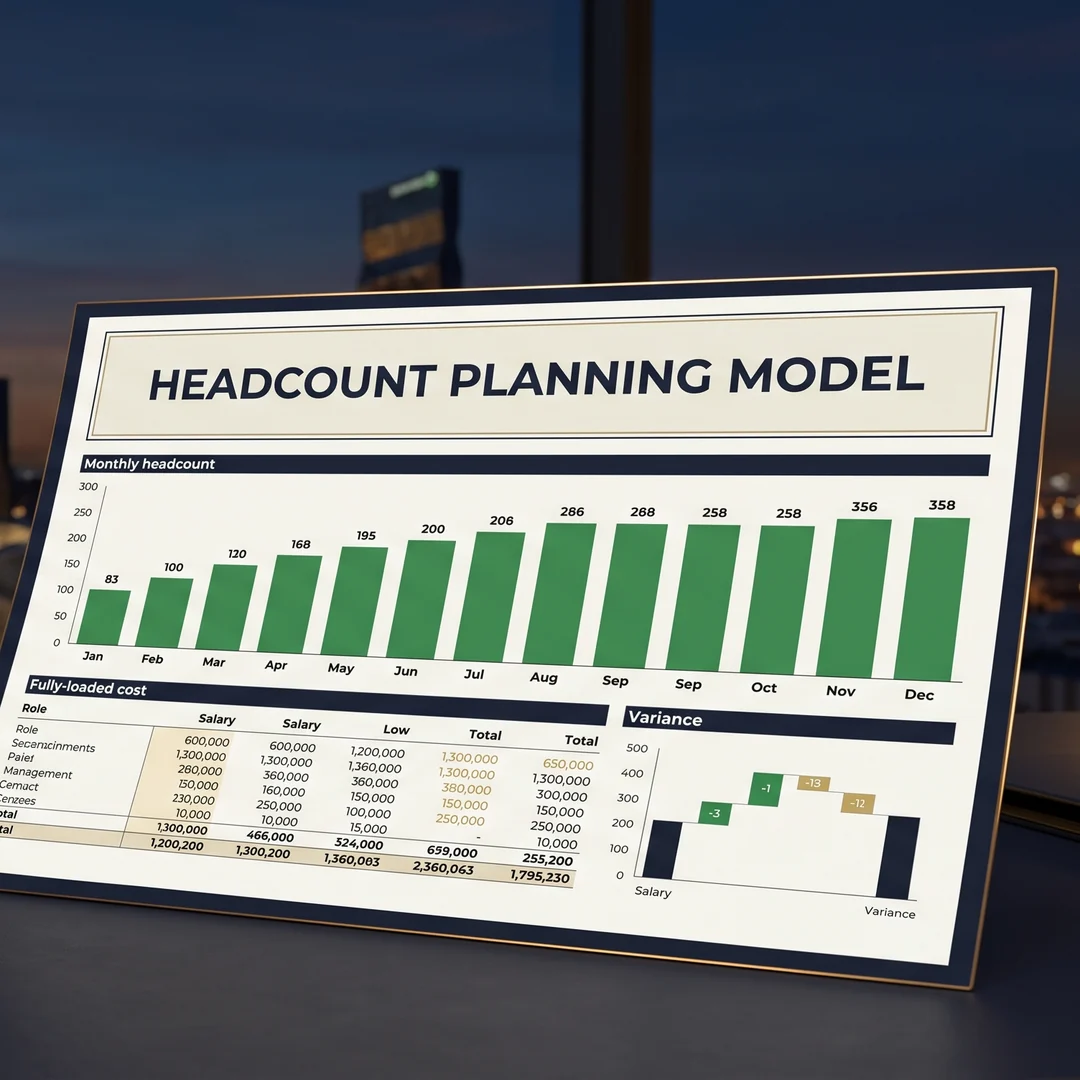
Headcount is the largest controllable expense most companies carry — and in most finance teams, the monthly cycle around it is spent producing the number rather than using it.
Not for lack of skill — the opposite. Strong analysts get pinned to a hard reporting deadline by how long the number simply takes to produce, and the report that goes out is thinner than the one they were capable of writing, because the hours went to assembly and not to insight. The roster is pulled, reconciled against the hiring plan, mapped to ERP actuals — rarely in a single pass, because the data arrives incomplete and the totals do not tie the first time. Then the reconciliation that actually matters, almost always done by hand: which seats were filled, at what level, and how that compares to what was budgeted for those specific seats. A couple of weeks are gone by the time the report exists, and the part of the work with real value — explaining what happened and what it means for next year — gets whatever hours are left.
None of that is a discipline problem; the effort is already there. It is a design problem — the assembly is manual, so it expands to fill the time and crowds out the analysis. The model I use inverts that: make the assembly mechanical, and the time goes to deeper analysis, with judgment following from it.
Here is how it is put together, and what each design decision buys.
Three tables and a date
Four seat-level tables and one actuals feed, and the analyst touches only three of them each month.
The live roster holds every current employee, one row per seat. The to-be-hired list holds every unfilled seat — open reqs and planned hires — in the same schema. A frozen pair holds both as they stood the day the budget was approved, and the ERP feed holds booked actuals by region, department, and expense type.
The monthly cycle is four steps:
The model holds a copy of the approved budget at full grain: every budgeted seat and every expense line, not a departmental total. That grain is the point. Because the model lines each budgeted seat up against its forecast, it compares plan to reality seat by seat — the precondition for the decomposition discussed later in this post.
Change is a row, not a rebuild
A business changes shape continuously, and the model has to evolve with it. When that upkeep is structural — re-pointing formulas, rebuilding mappings, extending logic sheet by sheet — it lands on the team as recurring work, arriving whenever the business reorganizes, which is rarely a convenient moment. So the design goal was to make change a matter of configuration, not construction.
Each engine sheet holds a single formula, pointed at the assumption tables rather than at specific cell positions; from their parameters it builds every expense line and routes each to its driver. So a change in the business is a change to a table.
The engine does not know individual expense items. It knows a small set of drivers: a flat rate on a base, a capped statutory item, a per-seat monthly cost, a one-time hit at hire. A new statutory item is a new row pointed at an existing driver.
Structural change is constant as a company matures — a new region opens for remote hiring, engineering splits into two departments, a new expense type appears. In a coordinate-built model any of these is a small project: new rows, new mappings, new formulas, old ones re-pointed across every sheet, and someone's week spent checking that nothing silently broke. Here each is a row in a table and a recalculation, and the model that ran in January is the same model in month eighteen.
Burden is a curve, not a multiplier
The most common shortcut in workforce cost is a fully-loaded multiplier: base pay times 1.3, or 1.4. It is portable, easy to explain, and wrong in both directions at once.
Employer burden is not a constant. It is a curve. Capped contributions charge in full early in the year and stop the month cumulative pay crosses a statutory ceiling, so a seat's effective burden falls through the year and resets every January. Merit steps at a defined month. Bonus funds and pays on its own schedule. The annual total can be perfectly correct while every single month inside it is wrong.
That monthly shape is where the multiplier does real damage, because cash forecasting runs on shape, not averages. Employer costs are front-loaded, and a flat multiplier smears them into twelve equal slices — so a treasury view built on it is wrong in Q1 one way and Q4 the other, even when the year foots. Modeling the curve gives the cash forecast a payroll line with the right shape.
Jurisdictions vary the curve further — some cap contributions quickly and cheaply, others carry employer costs into the low twenties as a percentage of pay. The arithmetic for any one of them is ordinary; the weight is the problem. Computed the conventional way, the calculation is written into every cell it touches — every statutory line, for every seat, for every month — and at real headcount across several jurisdictions that is what pushes a workbook into minutes-long recalculations, or a seize. This model runs the whole population through one compact calculation instead, which is what lets it hold this detail and still open in seconds.
That same calculation absorbs the shapes themselves, and real statutory regimes carry a full zoo of them: a ceiling that stops charging above a threshold, a floor that starts only above one, a band that charges within a window. The Gulf is where the zoo is richest. End-of-service benefit accrues only for expatriate staff, not nationals; its accrual rate steps up once an employee crosses a tenure threshold; and that step-up forces prior service to be revalued retroactively at the crossing, and again at every raise. Eligibility, a tenure step, and a retroactive true-up on a single line item — expressed as parameters on that line, not as bespoke logic bolted onto the engine.
One seat, one identity
When a role is opened it is either a new seat or a backfill for one that emptied. HR already knows which and records it — the distinction is part of how requisitions are run. It just rarely reaches finance in a usable form. This model asks for it and builds on it.
Every system already carries an employee ID, and every planned hire a TBH ID. The model asks only that a backfill TBH be tagged with the ID of the seat it replaces, and that the eventual hire be linked to the predecessor it stepped into.
That chain turns a role planned for March, filled in June, vacated in October, and backfilled in January into one seat with a history rather than four unrelated rows sharing a title — so cost and timing land on the originally budgeted seat, not on whoever occupied it. It is what makes the decomposition possible: you cannot separate hired-late from hired-expensive unless the model knows it is looking at the same seat both times.
Better no number than a wrong one
Every engine in the workbook is gated. If the validation layer finds a structural problem — an actual booked to a region, department, or account the model does not cover — the output layer returns SYSTEM HALTED instead of a number, and names the specific item that is missing.
This is deliberate, because of how the alternative develops. Something breaks mid-cycle. The analyst traces it, judges the cause benign, wraps the lookup in IFERROR, and moves on to the analysis that is due. The judgment is right in the moment. But the fix is a blunt instrument: it does not suppress that one error, it makes the model more forgiving from then on. A few such judgments across a few cycles and the model has quietly lost the ability to tell you when something is wrong. Eventually something that should have been caught resolves to a plausible zero, and a zero reads as a number.
A system that refuses to produce a number it cannot stand behind removes that risk at the source. That is a small mechanical decision with a disproportionate organizational effect: it changes whether the output is trusted by default — or quietly audited every month, at a cost in hours nobody ever tallies.
The commentary is a column, not an investigation
All of that structure exists to support one output: for every line, not just the size of the variance but its cause, decomposed into timing, rate, and one-time effects, reconciling to the total.
Timing isolates when and how much a seat was staffed, valued at plan. Rate isolates cost per staffed month — chiefly, seats filled above or below their budgeted compensation. One-time covers recruiting fees and equipment. Because the same expense map that routes each line to a driver also assigns it to one of these, the decomposition is not fixed to today's lines: add an expense, map it once, and it flows into the bridge with the rest. A fourth column carries the variance with no seat-level cause at all — because real actuals never match a smooth forecast, travel lands lumpy and a renewal hits in one month, and a bridge that reconciled to the dollar against them would be claiming more than it can know.
Run a typical mid-size SaaS payroll through this — say 350 people across six countries — and the pattern is familiar. The year lands over a million dollars under budget, which reads as a win. Almost all of that favorability is timing: hiring that slipped. Underneath it, rate is unfavorable by a few hundred thousand — and rate is the only component that carries forward, because a seat filled above plan costs more in perpetuity, not just this year. The headline and the only durable number in the decomposition point in opposite directions.
The analyst does not investigate that. It is already computed, at department, region, and expense-line level, in columns that tie.
Advising, not assembling
Close week stops being about production. The commentary is read out of the model rather than assembled into it, which means the questions the team spends its time on move up a level: not what the variance was, but which parts of it are permanent, what they imply for next year's plan, and what leadership now needs to decide.
And it changes the conversation with the business, which is where this earns its keep. Told only that the company is a million under budget, a reasonable executive hears a million available to invest — a sound inference from what they were given. It is also incomplete. Some of that favorability is money genuinely saved, but not all saved money is equal: a dollar under on rate is saved every year, while a timing dollar either reverses or is a one-time benefit. And underneath the headline the run-rate on the existing team has already risen. With the full picture the same executive might still spend the million — even on headcount that lifts the run-rate further — but now deliberately, rather than as a surprise next planning cycle. Supplying that picture is the finance partner's job, and the model exists so the analyst reaches it without deriving it by hand.
That is the return on building it this way. Everything rule-based, the model resolves: any conclusion derivable from the seats, rates, calendar, and bounds is computed rather than assembled, at every level, in columns that already tie. What remains is the genuinely bespoke work — the questions specific to this business this quarter, the judgment about which movements matter, and the conversation that turns an explanation into a decision. That is the more valuable half of the job, and the half that gets squeezed when the first is done by hand.